

Secondary
Problem: how many books were read?
Five learners read 2, 3, 3, 4 and 18 books over one period. This is a fictional example. Find the mean and median, then consider which summary suits the question.
Calculate both summaries
The total is 30 books, so the mean is 30 ÷ 5 = 6. In the ordered list, the third value is 3, so the median is 3. Both are correct but use the data differently.
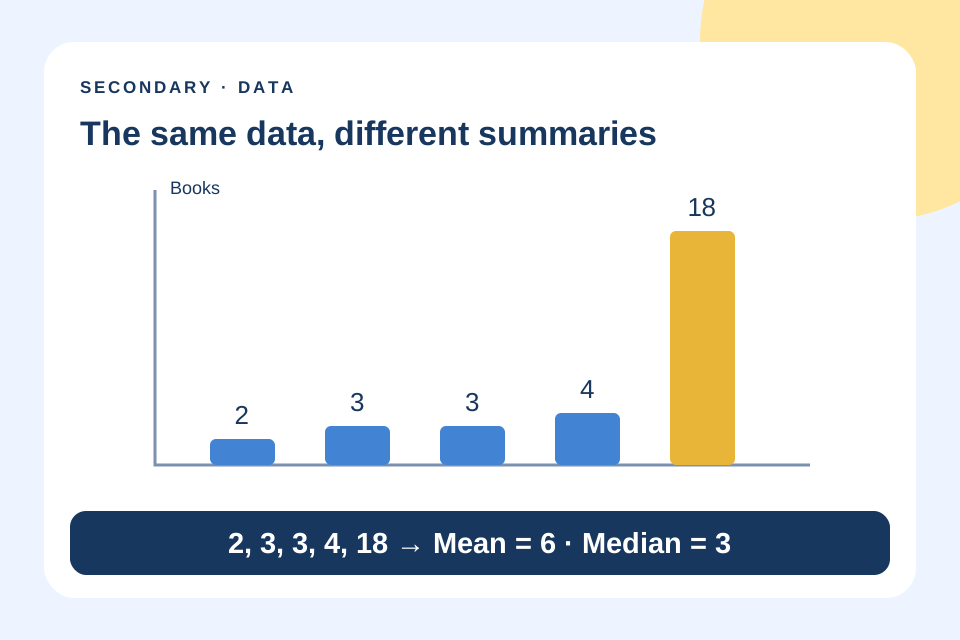
The fictional data 2, 3, 3, 4, 18 has mean 6 and median 3. Notice how far 18 lies from the other values.
View larger image ↗What does the large value change?
The value 18 raises the total and mean considerably. The median depends on the middle position. To discuss a count closer to most learners in this group, the median is useful, but show the actual data too.
Extend: change one value
Replace 18 with 8. The total becomes 20 and the mean 4, while the median stays 3. Check the ordered values and explain why disagreement with the median does not make the mean incorrect.
Keep exploring together
Choose activities that match the learner’s knowledge and readiness, and discuss what you notice. Explore the curriculum or parent guide below.