

Secondary
Read labels and units
Ask what the horizontal and vertical axes represent, such as days and books read. Missing labels or units limit interpretation.
Check the scale intervals
Check whether intervals are equal and whether the axis starts at zero. Bar height alone can give a misleading impression of differences.
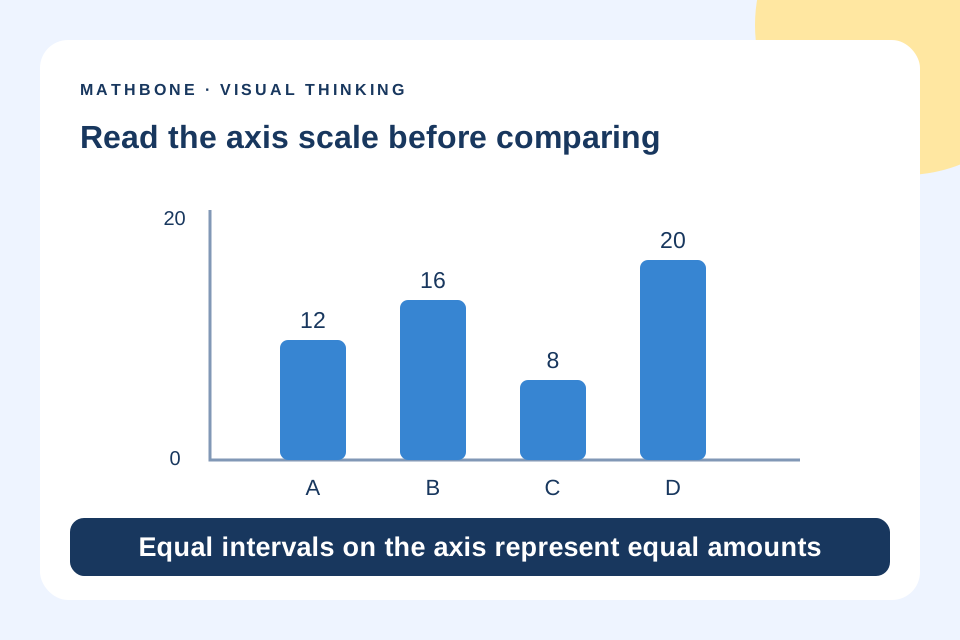
This example uses a zero baseline and one consistent scale. Values for A to D are 12, 16, 8 and 20.
View larger image ↗Separate observation from prediction
State what the data shows, such as the highest observed value, before discussing assumptions needed to predict the next day.
Keep exploring together
Choose activities that match the learner’s knowledge and readiness, and discuss what you notice. Explore the curriculum or parent guide below.